Investing · 2026.10.10 · 6 min
Backtest Numbers Lie: The Pitfalls I Hit in Strategy Research
A pretty backtest doesn't prove a strategy works; these are the pitfalls I hit, from TradingView understating drawdown to missing random baselines, dirty data, short samples, and lookahead, and how I avoid each.
Reading

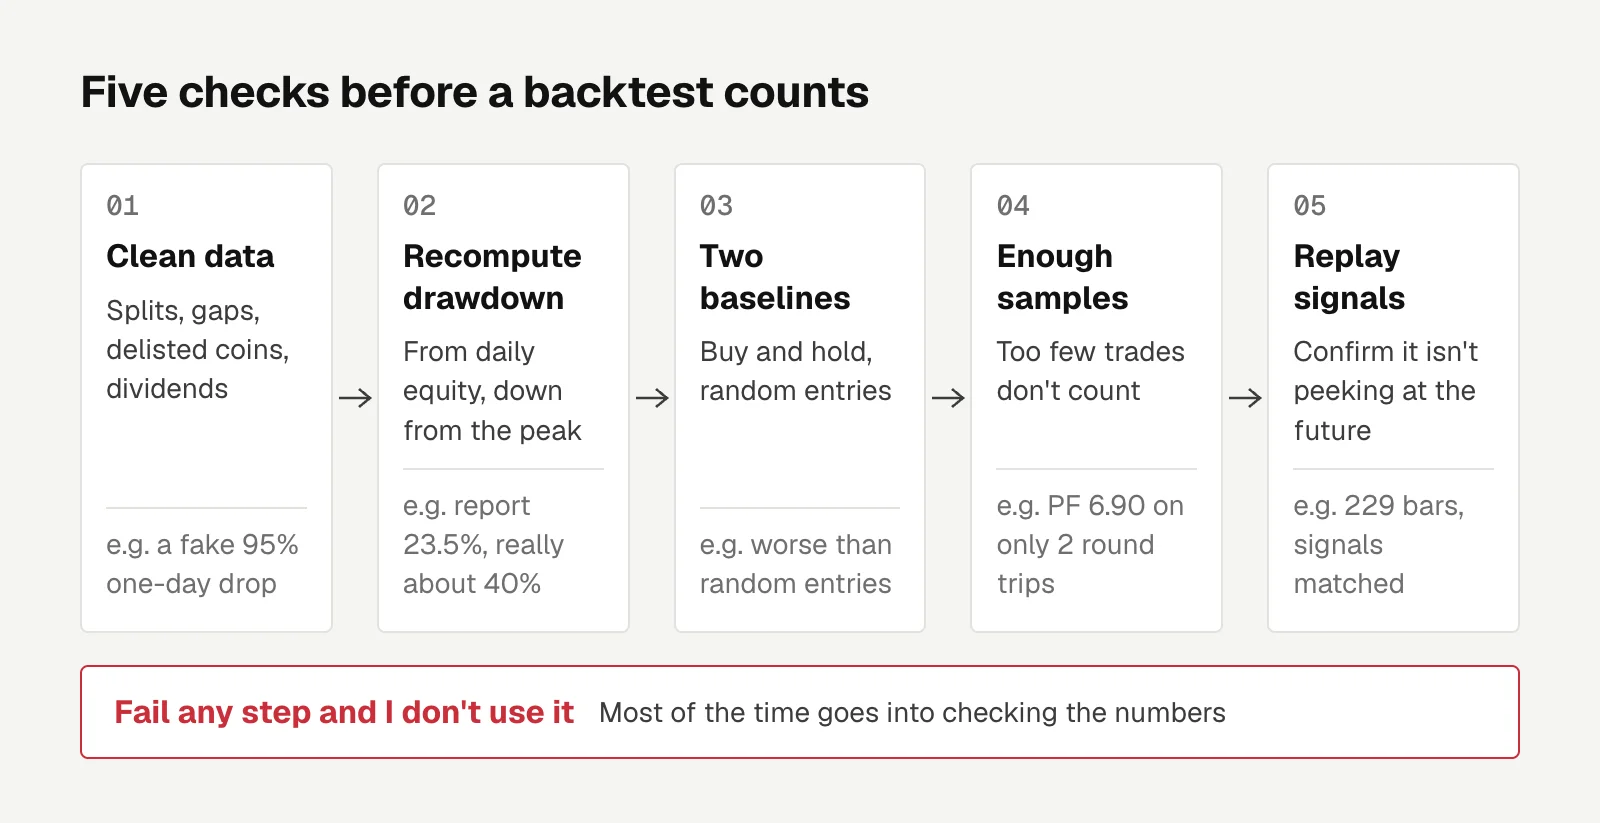
I've backtested a lot of strategies lately. Writing the strategies didn't take long. Most of the time went into checking whether the numbers were right. Several times the conclusion nearly flipped completely: the report said a 23.5% drawdown when it was really about 40%, and a strategy that looked like it had an edge turned out to be worse than entering at random.
My checking order now: clean the data first, compute drawdown myself, compare once against buy and hold and once against random entries, throw out anything with too few samples, and finally use replay to confirm it isn't peeking at the future. If it fails any step, I don't use it.
Compute max drawdown yourself from daily equity
The max drawdown in TradingView's strategy report only counts open losses below the entry price. It doesn't count profits given back while the position is still open. Say a trade goes from 100 to 150, then falls back to 110 and exits. On the account, 150 to 110 is a very real drawdown, but because it never went below the 100 entry, the report doesn't count it. Trend strategies often ride a move up and then give back a big chunk, so the gap can be large.
Examples I ran into: 00631L (a 2x leveraged Taiwan 50 ETF) with Hull 144 showed 23.5% in the report and about 40% recomputed. A BTC daily trend strategy showed 28.7% in the report and 62.1% recomputed. If you compare using the report's numbers, timing strategies look much safer than buy and hold.
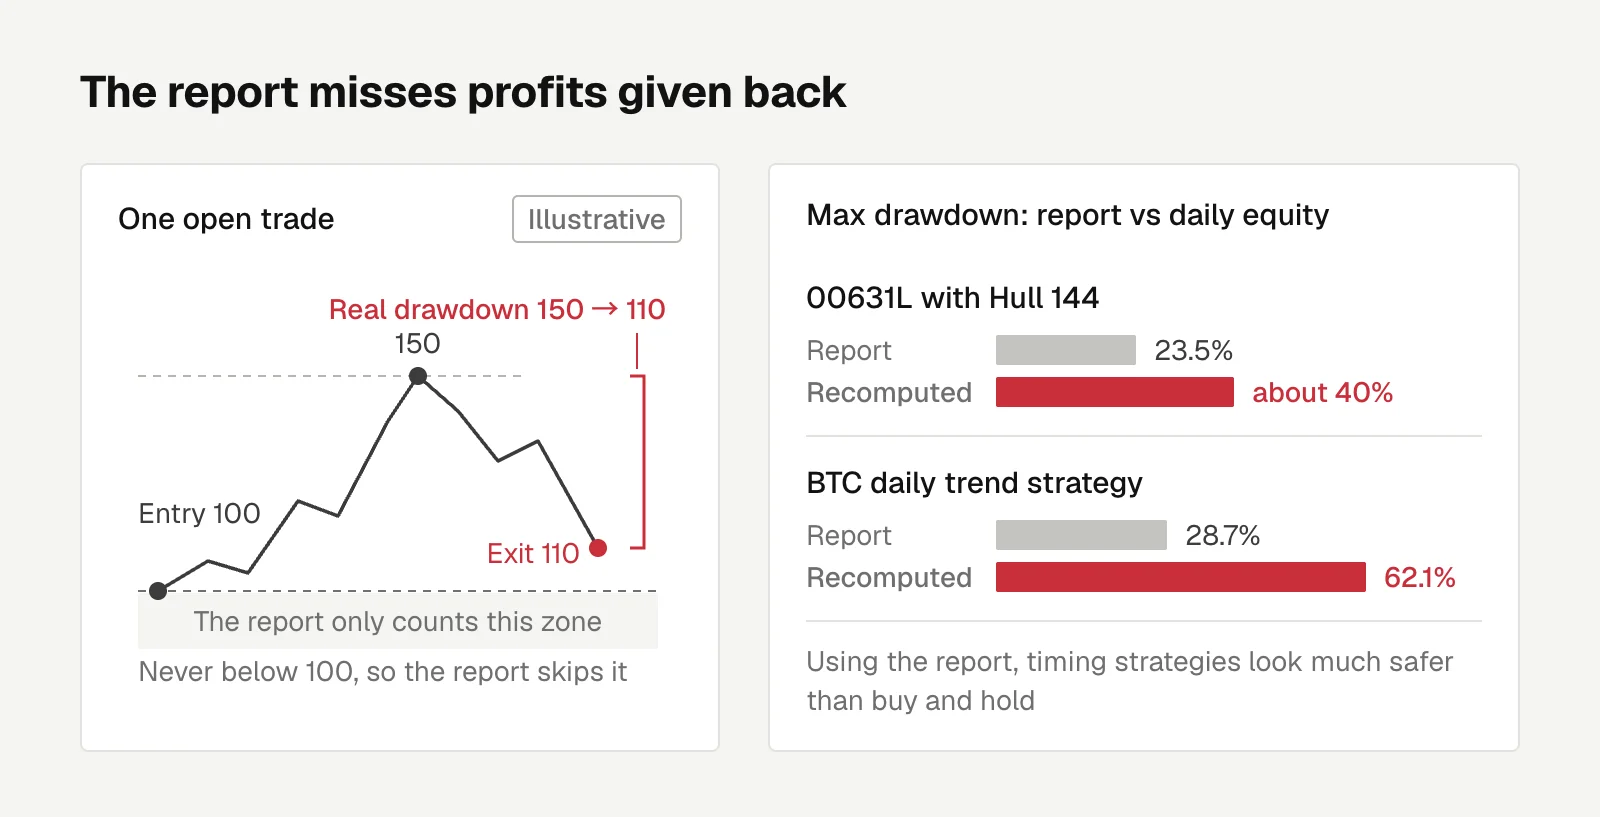
The fix is to compute equity at every daily close and measure down from the peak:
def max_drawdown(equity):
    peak, mdd = equity[0], 0.0
    for v in equity:
        peak = max(peak, v)
        mdd = max(mdd, 1 - v / peak)
    return mdd
Without a control group, you can't tell edge from market drift
This is the one I got wrong most often. A payoff structure with a small stop and a big target will show positive expected value in a drifting market even if you enter at random.
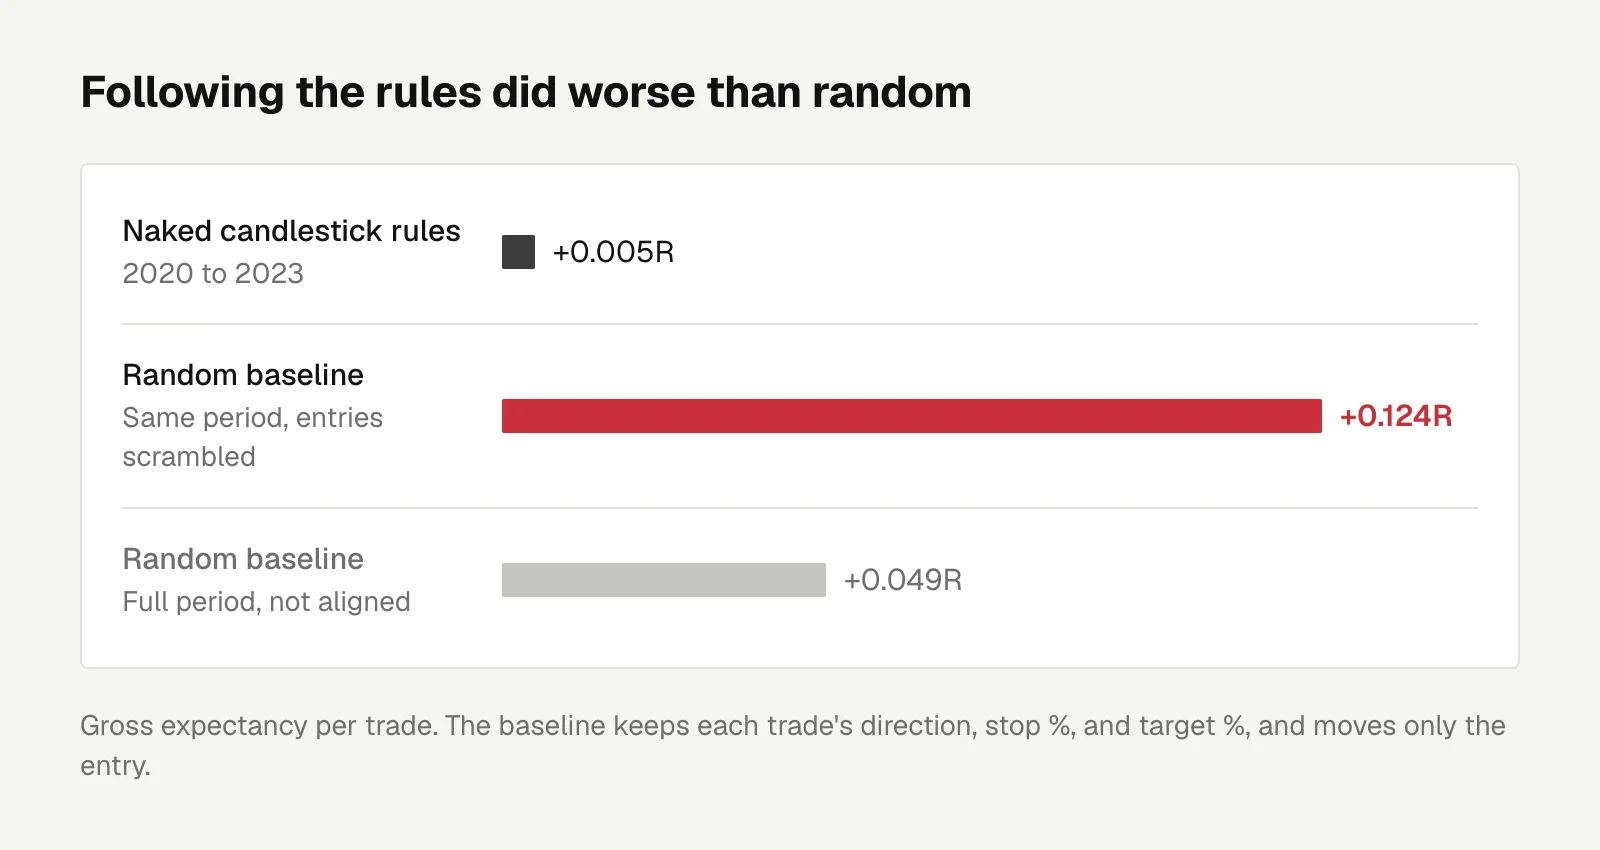
I turned a set of naked candlestick (price-action) patterns for Taiwan stocks into rules and backtested them. 2020 to 2023 came out at a gross +0.005R (R is return measured in units of the stop distance). Rerunning the same trades with only the entry times scrambled gave a random baseline of +0.124R. Following the rules was worse than trading at random. The full process is in the naked candlestick backtest post.
For the control group, I keep each trade's direction, stop %, and target %, move only the entry to a random spot in the same symbol, and run it through the same backtest engine:
for st in real_setups:
    j = rng.randrange(warmup, len(df) - 2)      # pick a random bar in the same symbol
    px = float(df["close"].iloc[j])
    stop_pct = abs(st.entry - st.stop) / st.entry
    tgt_pct = abs(st.target - st.entry) / st.entry
    fake.append(TradeSetup(j, st.side, px,
                           px * (1 - st.side * stop_pct),
                           px * (1 + st.side * tgt_pct)))
Run the random version 10 or more times and take the mean and standard deviation. Beating the baseline by 1 to 2 standard deviations is noise, and every extra version you try raises the bar further.
The control group can go wrong too. The baseline has to cover the same period as whatever it's compared against. In my case the full-period baseline was +0.049R, but for 2020 to 2023 alone it was +0.124R. Compare against the full-period number and a negative result turns positive. When you change the entry conditions, the stop and target distribution of the trades that remain changes as well, so every version needs its own baseline.
Clean the data first
Yahoo's 00631L data isn't split-adjusted before 2015, so one day shows a fake single-day drop of 95%. 00631L also did a 22-for-1 split on March 31, 2026, and TWSE (the Taiwan Stock Exchange) publishes raw prices. I adjusted them myself from TWSE daily data: divide the previous day's close by the day's reference price, treat a ratio above 1.5 as a split, and divide all earlier prices by it. That one came out to exactly 22.
A single missing day causes trouble too. Yahoo had a null for September 22, 2026, and with one bar missing the HMA no longer matched TradingView, so I switched to TWSE's STOCK_DAY.
Two more. Of Binance's 705 USDT trading pairs, 212 have been delisted, and if you only pull coins that are still trading, the results look too good to be true. And 0050 (the Taiwan 50 ETF) returned 17.7% a year from 2015 to now on price alone, but 21.4% with dividends reinvested, so when comparing, both sides need to include dividends or both leave them out.
Short samples make the numbers jump around
TradingView's Basic plan can only backtest over the range the chart can load. When I tested BTC, the highest profit factor was 6.90 on 15-minute candles, but that covered only about 2 months and 2 round trips. Only the daily chart had enough samples. Details are in the BTC daily strategy post.
Performance reports online have the same problem. For one report claiming 146% a year on 15-minute TAIEX futures (Taiwan's index futures), I wrote the same logic myself: +152% a year in sample, -35% in a blind test. That report only covered about 14 months, and annualizing a short period blows up the return.
Confirm the strategy isn't peeking at the future
Some indicators repaint, or use data you can't have until the bar closes. The historical backtest looks great, and then live trading doesn't match.
I use TradingView's Bar Replay to step through bar by bar and check whether the signals that appear in real time are the same ones as in the historical backtest. For the BTC daily strategy I replayed 229 bars and the signals matched exactly. Then I reconciled it against an offline simulator I wrote, and the entry and exit times of all 60 trades lined up. When you can't see an indicator's source code, this is one of the few ways to confirm it isn't peeking at the future.

Engineering
Code Review After the Rust Port: 15 Findings, 6 Carried Over from Java
Four lessons from a full code review after a Java-to-Rust port: transaction semantics copied from a misleading annotation, sqlx returning Ok on failed commits, disconnects killing handlers, and suspension sharing the lending flag.
Letters
Loading comments…