Investing · 2026.10.10 · 5 min
From 1,000 to 10,000 USDT in Paper Trading: A Trend Strategy from Backtest to Shutdown
A trend strategy that backtested at 240x lost 10.7% in 2.5 days live; a hindsight-picked coin list had inflated it, and with point-in-time rankings, 10x in a year only happened from a bull-market start.
Reading

I set up a virtual account with 1,000 USDT and challenged myself to grow it to 10,000. A trend strategy that backtested at 240x lost 10.7% in its first two and a half days live. The research I did right before ending it was the real point: the 35 symbols I used were picked after the fact, and about 65 percentage points of the backtest's annual return came from peeking at the future. Switching to the top 35 by trading volume at the time, every case of reaching 10x within a year came from a 2020 start. Whether you can 10x comes down almost entirely to whether another big bull market shows up.
The ledger only changes through fills, funding, and liquidations
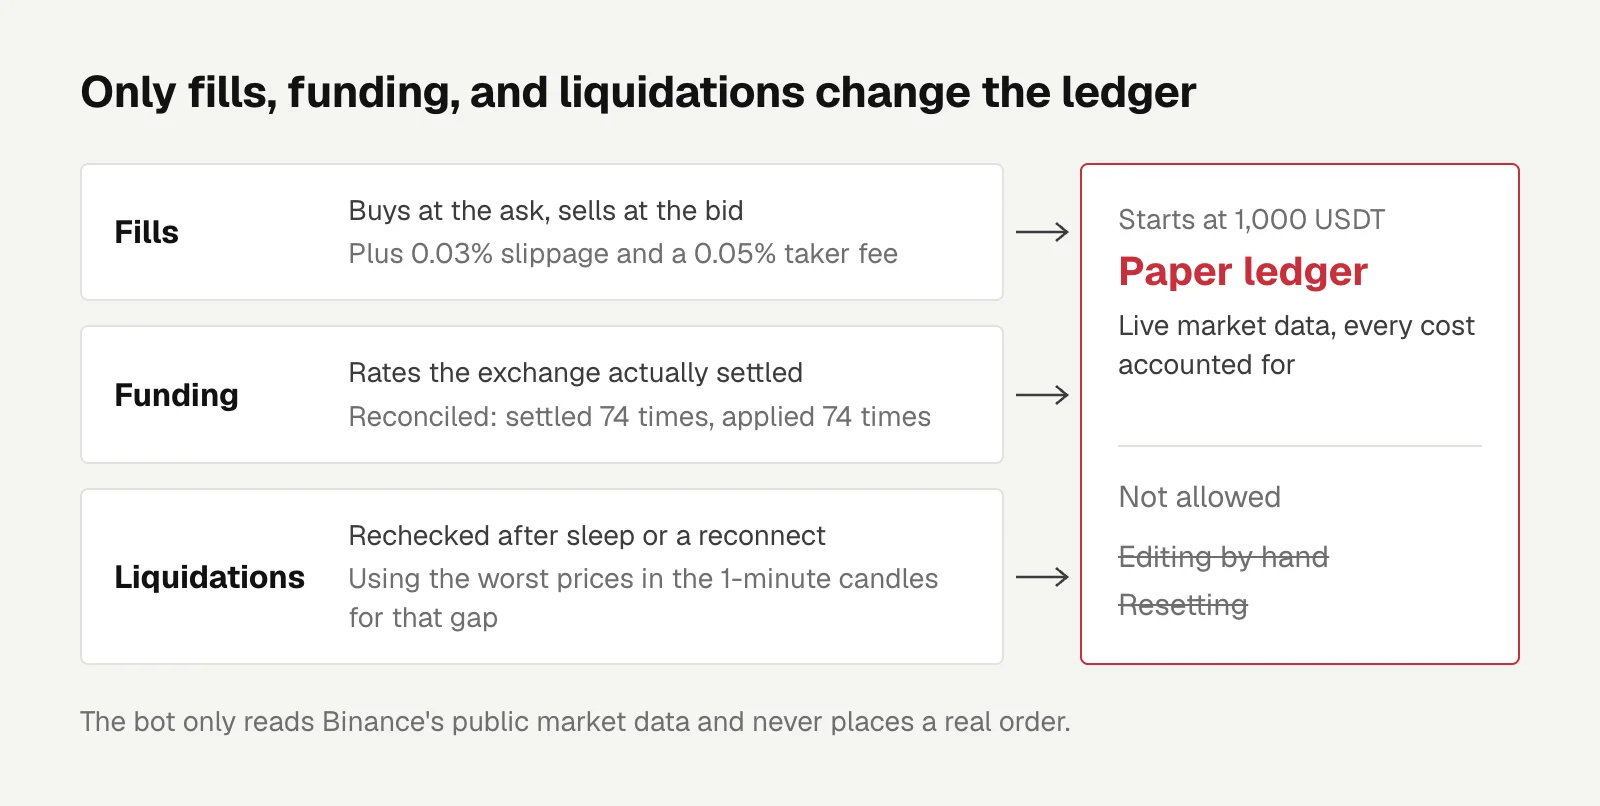
For the results to mean anything, I set two conditions. The strategy needs backtest evidence and has to honestly report its odds of 10x and its drawdowns. The paper ledger has to run on live market data with every cost accounted for.
The ledger can't be edited by hand and never resets. Buys fill at the ask and sells at the bid, plus 0.03% slippage and a 0.05% taker fee. Funding uses the rates the exchange actually settled. When the computer wakes from sleep or reconnects, it reruns liquidation checks using the worst prices in the 1-minute candles for that gap, so losses don't slip through just because nobody was watching. The bot only reads Binance's public market data and never places a real order.
I reconciled funding too. After the account opened, held symbols settled funding 74 times and the bot applied it 74 times. Some symbols settle every 4 hours and others every 8. Miss a detail like that and costs quietly go uncounted.
A strategy that backtested at 240x
The data was 35 high-liquidity Binance USDT-M perpetual contracts: 1-hour candles from January 2020 plus the full funding history. Comparing six signals at the same volatility target, a long-only daily Donchian 55/20 came out best, with a Sharpe of 1.10.
I then adopted a few improvements: let winners run without trimming, add a BTC 200-day moving average filter, execute on 4-hour bars, and average the 20/10 and 55/20 sets. Among the ideas I rejected, skipping longs when funding runs hot dropped the 10x probability to 3% to 10%, because the highest rates usually come during the steepest rallies. Shorting in bear markets got squeezed in 2025 and lost 46% to 61%.
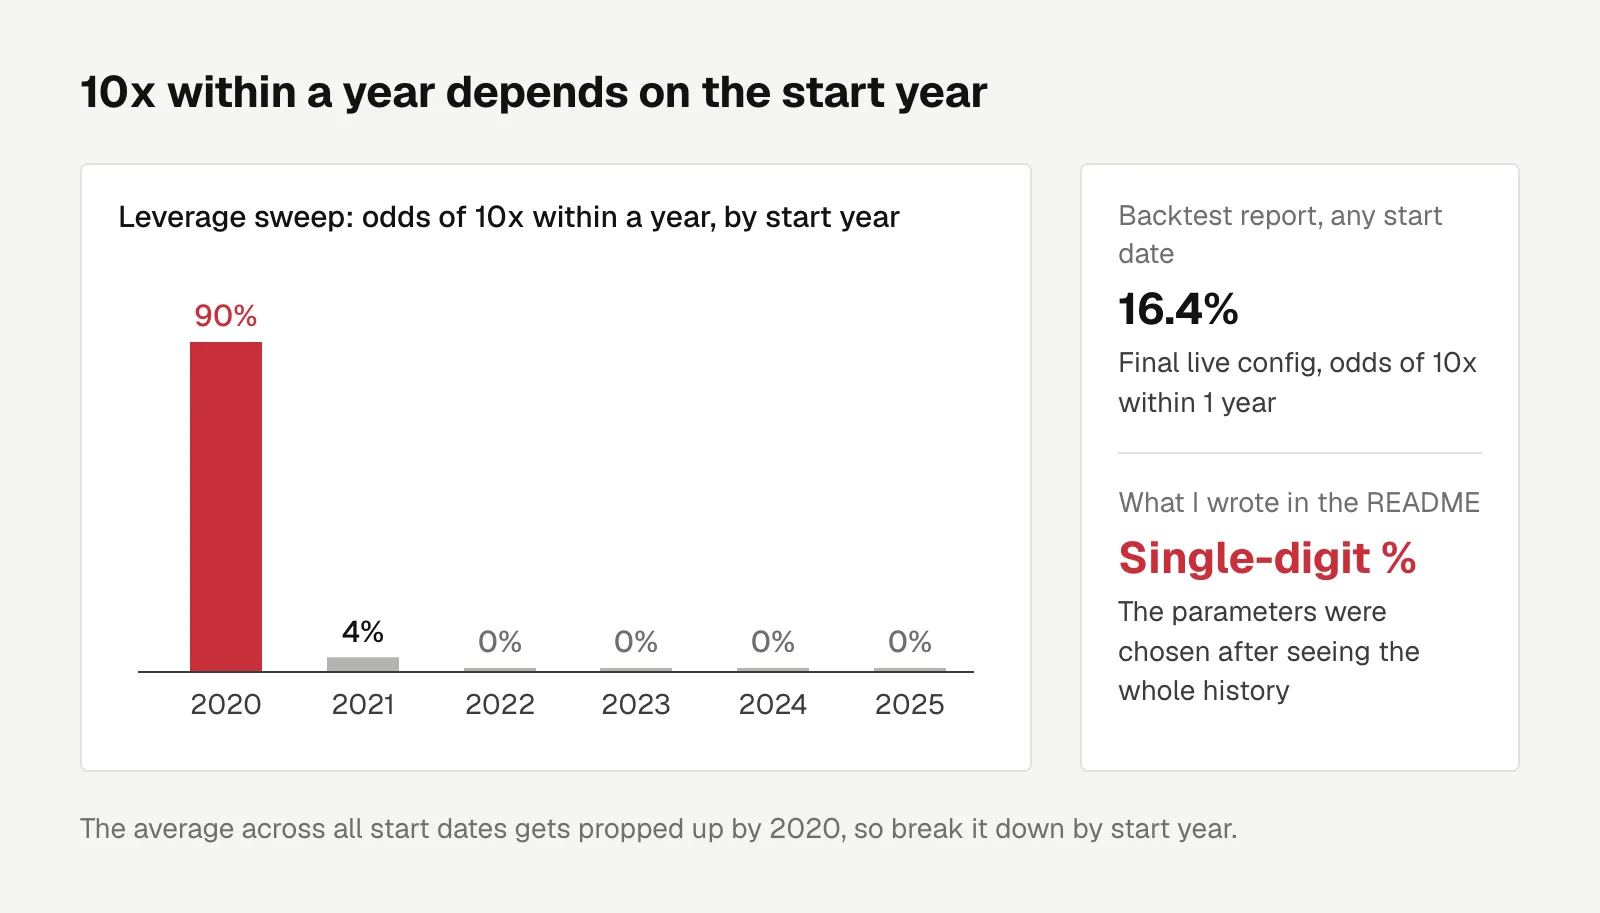
The final live config was 4-hour candles, long only, volatility-weighted, with a target gross leverage of 3x and forced deleveraging above 3.5x. Backtested from January 2020 to September 2026 with fees, slippage, and actual funding, it returned 240x: 125% annualized, Sharpe 1.38, max drawdown −73%. From any start date, the probability of hitting 10x within 1 year was 16.4%, and within 2 years 27.6%.
I measured the cost of funding as well. Annualized return was 121.6% with funding and 152.7% without, so funding ate about 31 percentage points a year.
The warning signs were there early. In the leverage sweep, the probability of 10x within a year was 90% from a 2020 start, 4% from 2021, and 0% from every start in 2022 through 2025. The parameters had also been chosen after seeing the whole history, so the expectation I actually wrote in the README was a single-digit percent chance of 10x within a year.
Two and a half days live
At open, going by the signal on the latest 4-hour candle, it opened longs on 34 symbols for a total exposure of 2.92x.
On day two, drawdown from the peak crossed −20% and triggered the loss review I had written in advance. The verdict: the implementation was fine, the loss was within historical range, keep the strategy. I wrote a separate post about the review mechanism.
When I stopped, equity was at −10.7%, after a high of +3.9% and a low of about −17.9%. The account opened right at the tail end of a big rally. The backtest showed the strategy had gained about 70% in the 30 days before open, and right after going fully invested it ran into a market-wide pullback.
Those two and a half days also showed something the backtest report hadn't made clear: an average annualized volatility of 86% understates the risk at high leverage. On days when the prior day's leverage was 2.5x or more, the standard deviation of daily returns was 10%, about 190% annualized. A 10% move in a day was normal.
A fixed list of 35 is hindsight
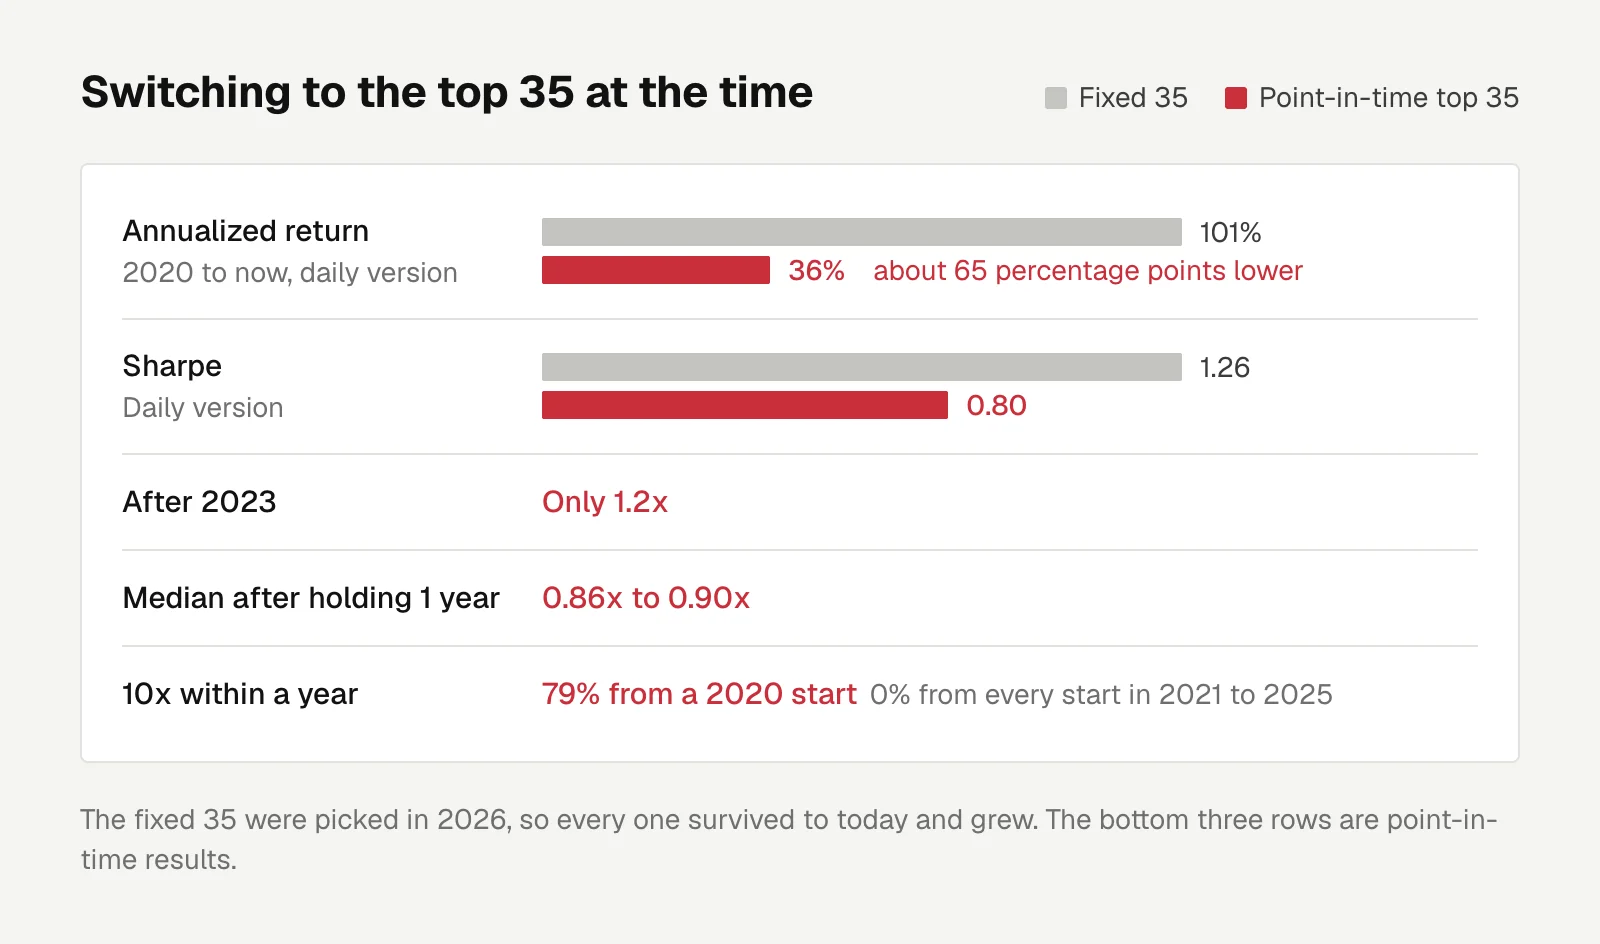
I picked my 35 in 2026, so every one of them is a coin that survived to today and grew. If you instead use only the top 35 by volume on each day (point-in-time), comparing on the daily version, annualized return from 2020 to now falls from 101% to 36%, Sharpe falls from 1.26 to 0.80, and after 2023 the whole thing returns only 1.2x.
Re-running the leverage sweep on the point-in-time universe, long-run growth peaks at a volatility target of 1.5 to 2.0. The 2.5 I used was trading growth for a better shot at 10x. The median outcome after holding for one year was 0.86x to 0.90x. Every case of 10x within a year came from a 2020 start (79%), and starts from 2021 through 2025 were all 0%.
That same day I dropped the 10x goal and ended the project. None of the code, market data, or ledger was kept.
What I learned
- The universe has to be point-in-time too. Use "top N by volume at the time" as the baseline from day one, or the backtest will systematically overstate. This time the gap was about 65 percentage points.
- The odds of 10x depend heavily on the market phase you start in. The average across all start dates gets propped up by 2020, so break it down by start year.
- Funding is a heavy cost for long-only trend strategies. Backtests need actual historical rates.
- The average volatility in a backtest report understates single-day risk at high leverage.

Engineering
Account Security Follow-ups: 2FA Copy, a JWT Expiry Race, and Client-Side Password Encryption
EZLO can reach users' exchange API keys, so after launch I fixed three account security issues: checking security copy against the backend, parsing JWTs once to avoid an expiry race, and encrypting passwords before sending.
Letters
Loading comments…