Tools · 2026.10.10 · 5 min
Illustrating Guide Articles: Image Models for Illustrations, HTML for Anything with Text
EZLO's 16 guides were text only. Covers now come from an image model plus a compositing script, figures with text are HTML screenshots, and every number on them is checked against public data.
Reading
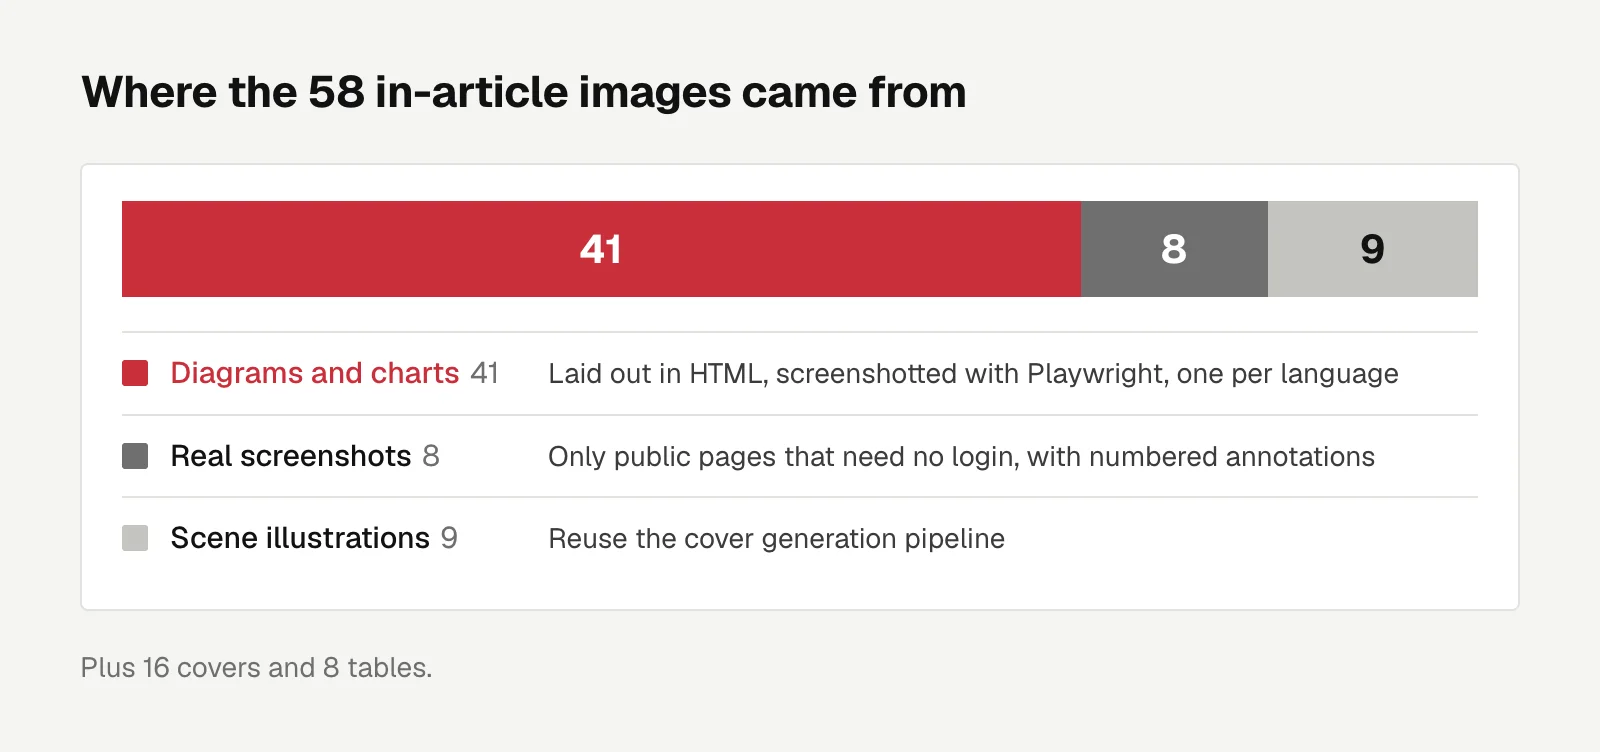
When I added images to the 16 articles in EZLO's guides section, I ended up splitting the work like this: illustrations without text go to an image model, with the style locked into the prompt, while figures and charts with text are laid out in HTML and screenshotted with Playwright. Image models get Chinese characters wrong. Text in HTML is always right and can use the site's color palette directly. In the end I added 16 covers, 58 in-article images and 8 tables, and every number on the charts was recalculated from public data.
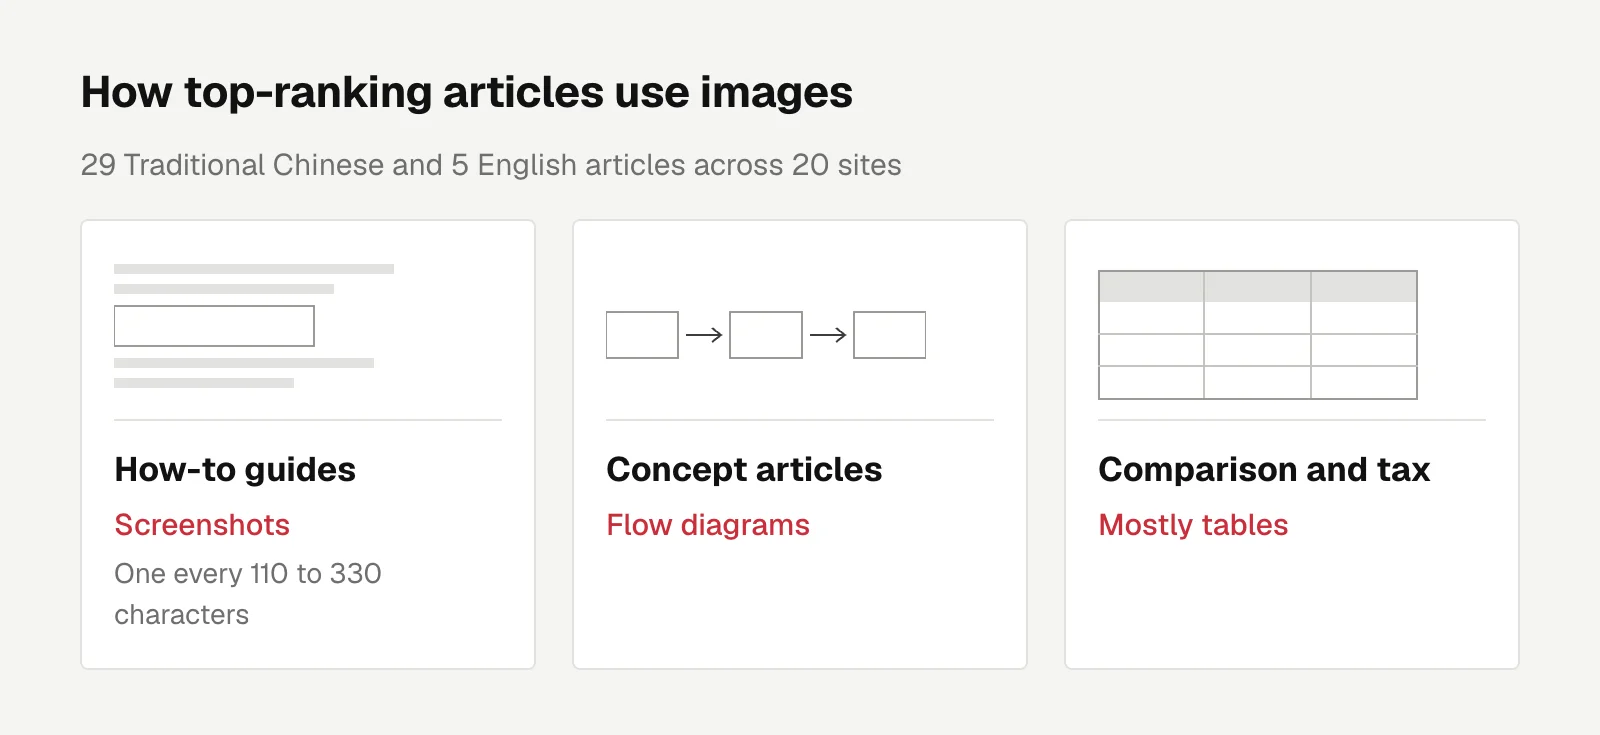
Before this, the list page was a solid column of titles, and every article's preview on LINE (the dominant messaging app in Taiwan) and Facebook used the same site-wide image. I started by surveying 29 Traditional Chinese articles and 5 English ones across 20 sites, and the pattern was clear. How-to guides had a screenshot every 110 to 330 characters, concept articles used flow diagrams, and comparison and tax articles relied mostly on tables.
Covers: style locked in the prompt, background left to compositing
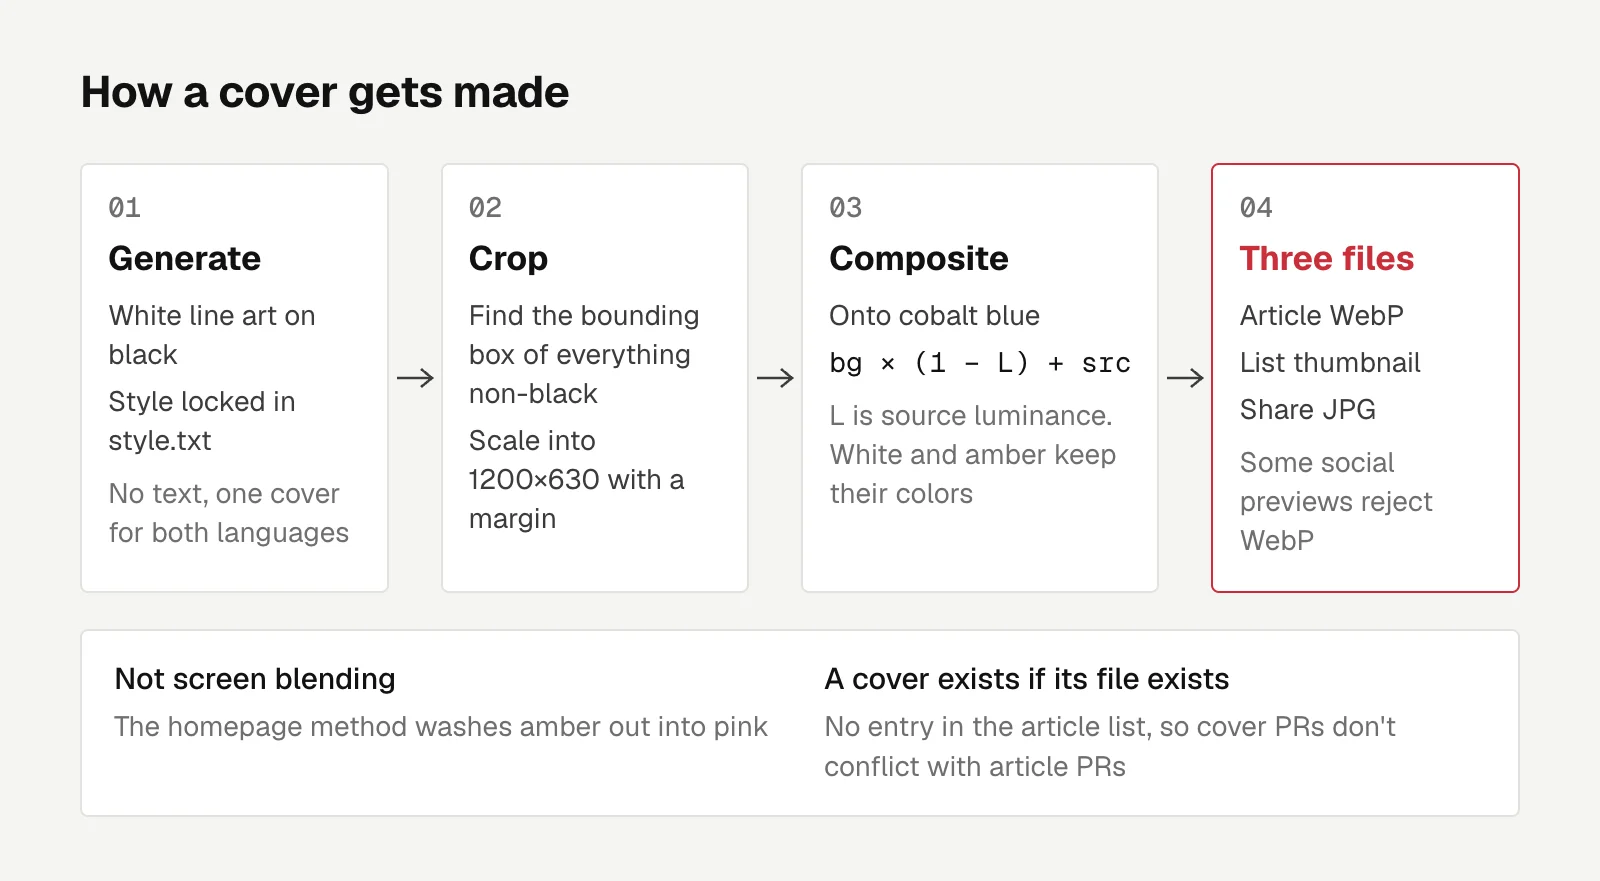
The covers follow the homepage's isometric line-art style, with one topic-related scene per article. The one about lending periods, for example, shows three hourglasses of different sizes. There's no text in the images, so both languages share one cover.
Consistency comes from the prompt. I locked the style into a shared style.txt: pure black background, white lines of uniform width, amber only for coins, no text allowed. That was enough. All 16 came out usable in a single generation pass, with no need to feed homepage images in as references.
The output is line art on black, which has to be composited onto the brand's cobalt blue background. The homepage line art gets rid of the black with screen blending, but screen washes amber out into pink. The final formula:
out = bg × (1 − luminance(src)) + src
Where the source is black, luminance is 0 and only the background remains. The brighter a pixel, the less the background contributes, so white lines and amber keep their original colors. Image models also tend to fill the whole frame, so a fixed crop would cut things off. Instead, the script first finds the bounding box of everything that isn't black, then scales it proportionally into 1200×630 with a margin.
Each article gets three files: a WebP for the article page, a thumbnail for the list, and a JPG for sharing, since some social platforms' previews don't accept WebP. Whether an article has a cover depends on whether the image file exists, not on an entry in the article list, so cover PRs don't conflict with article PRs that haven't been merged yet.
In-article images: anything with text is drawn in HTML
The 58 in-article images come from a few sources. Diagrams and charts account for 41 of them, laid out in HTML, screenshotted with Playwright and converted to WebP, with one version per language. The canvas is 560px wide and exported at 3x, so the text is still large enough on phones. Eight are real screenshots, taken only of public pages that don't require login, like Bitfinex's funding page, which is visible while logged out. I added numbered annotations on the form. The remaining 9 are scene illustrations that reuse the cover generation pipeline.
Comparisons weren't turned into images. I rewrote them as HTML tables, because search engines can't read text in images and it shrinks too small on phones. Images from other people's blogs come with copyright issues, so I didn't use a single one.
I also rewrote the MDX img. It reads each image's dimensions and sets width and height to avoid layout shift, and it lazy-loads. Before launch I checked all 32 article pages one by one, and none of them overflowed horizontally at 390px wide.
Numbers on the images have to match the text
Chart numbers come only from Bitfinex's public API. I re-pulled 12 months of 2-day candles and only drew the charts once the monthly medians, highs and lows I calculated matched what the articles said.
Only after drawing the FRR chart did I see that over the past 90 days, FRR had consistently stayed above the 2-day closing rate (11% to 13.6% versus 3% to 13%). Its gap from actual trade prices can't be explained by FRR simply lagging a beat behind. I wrote the caption to say exactly that and left the article text alone.
With more images, the maintenance rules need to be written down too. If a number in the text changes, the image gets redrawn. If a screenshot is retaken, the capture date in its caption gets updated. Everything is rechecked every quarter along with the competitor data.
Wrap-up
- Before adding images, look at how the top-ranking articles do it. It beats going on gut feeling.
- Draw images that contain text in HTML. The text is always right, and you can reuse the site's design tokens directly.
- Consistency in generated images comes from locking the style into the prompt. Leave the brand background to a compositing script.
- Only use public data for chart numbers. Recalculate them before drawing, and use them only if they match the text.

Engineering
The Admin Side of a One-Person SaaS: Trade-offs in Permissions, Broadcasts, and Notification Channels
Once my lending platform had users and billing, I built an admin console and multi-channel notifications; this covers permissions, kill switches, broadcast transaction boundaries, Telegram binding, and recipient rules for targeted broadcasts.
Letters
Loading comments…