Engineering · 2026.10.10 · 6 min
Should You Change Strategy While Losing? Writing the Review Process as Code
I wrote 'reassess if losses persist' as preset triggers and a fixed decision order; the first automatic trigger caught two bugs in the review code, and none of 13 risk-reduction variants passed the preset bar.
Reading

Before the paper trading started, I turned "reassess if it keeps losing" into fixed triggers and a fixed decision order. The first time it fired on its own, the report gave two wrong verdicts in a row, and both came from bugs in the review code itself. Once those were fixed, the verdict was normal volatility: keep the strategy. The report also flagged a portfolio-level risk, so I tested 13 ways to reduce it, and none passed the criteria I had set in advance.
This is a byproduct of the 1,000 to 10,000 USDT paper trading project. "Reassess if it keeps losing" sounds reasonable but is hard to actually carry out. How much loss, for how long? And while you're actually losing, the thing you most want to do is change parameters right away. So I hardcoded the triggers and the process ahead of time. The report has to tell apart three cases: a bug in the implementation, a strategy assumption that no longer holds, or plain normal volatility.
Triggers and what the report contains
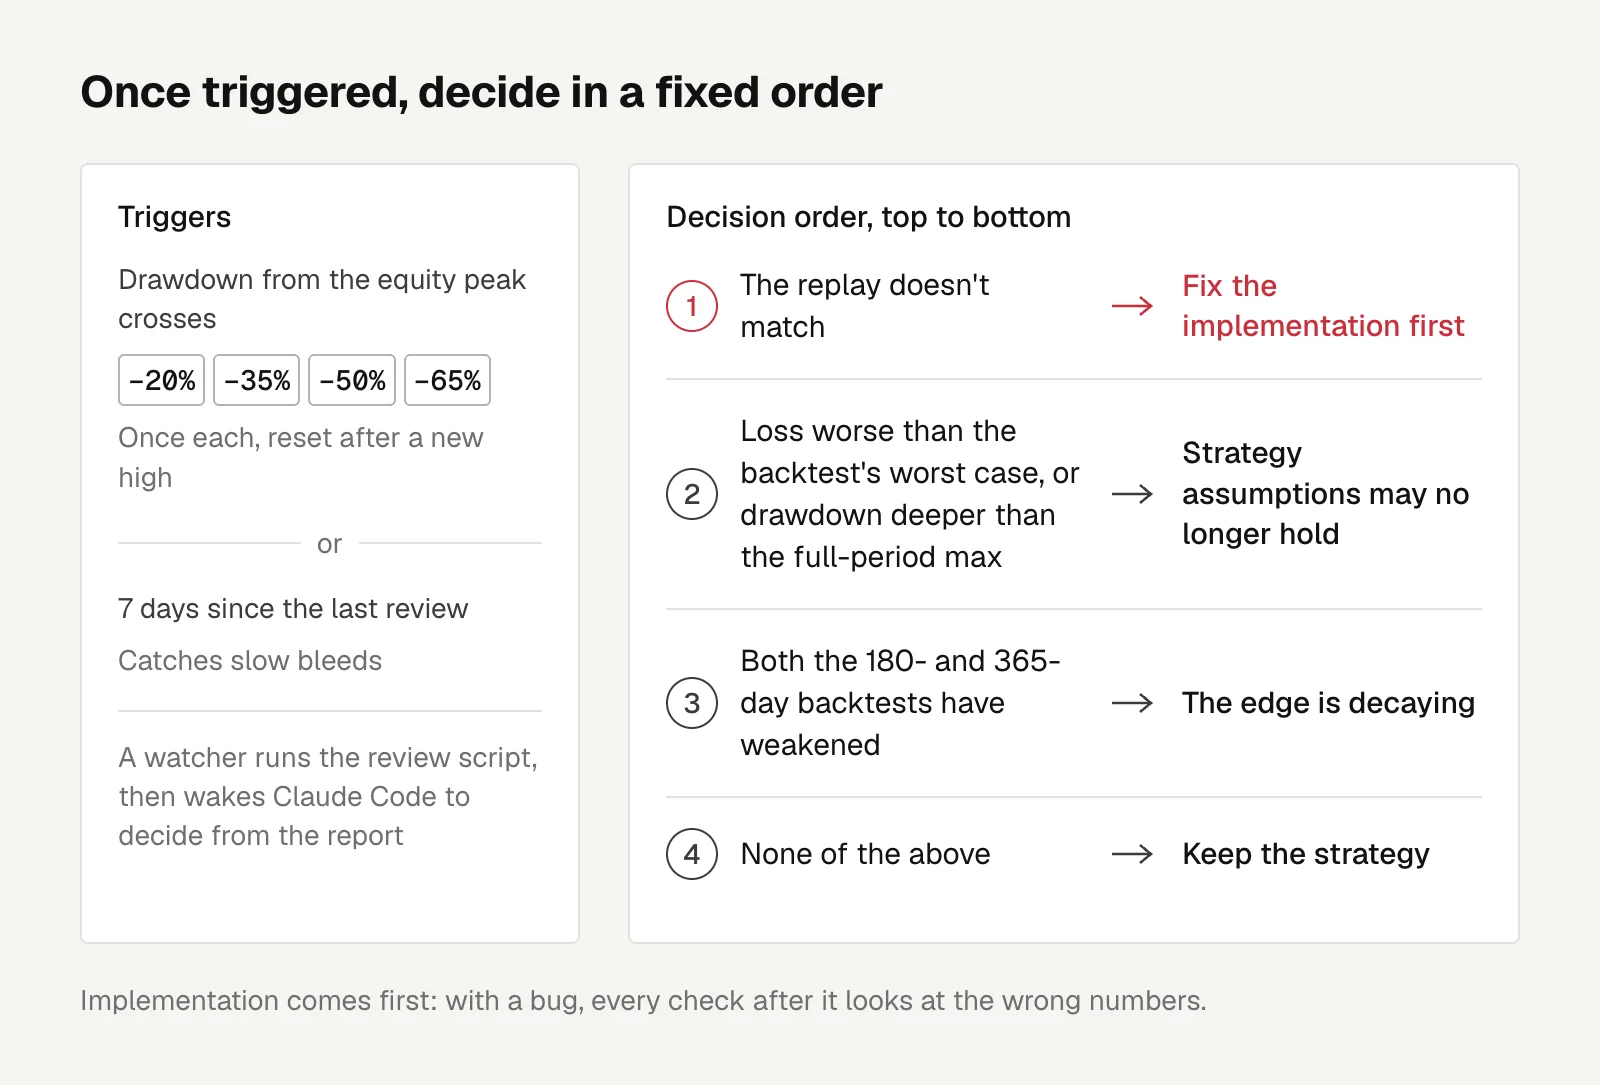
It fires once each time drawdown from the equity peak crosses −20%, −35%, −50%, and −65%, and the levels reset after a new high. It also fires when 7 days have passed since the last review, to catch slow bleeds. When a background watcher detects a trigger, it first runs the review script to produce a report, then wakes up Claude Code to make a call based on that report.
The most important part of the report is implementation consistency. Starting from the actual positions and cash at the candle where the live account opened, it replays the backtest and compares, symbol by symbol, every position size, every rebalance, and the equity at every 4-hour close. Position sizes carry no price noise, so they're the most precise consistency check. Equity tolerance is max(2%, 1% × leverage), because live uses mark price and the backtest uses fill price, and leverage amplifies the gap between them.
The other three sections are P&L attribution, a historical comparison (the distribution of returns and the worst case over the same length of time, following starts at 2.5x leverage or more), and backtests over the last 30 to 365 days to see whether the edge is decaying.
Decision order
- If the replay doesn't match, fix the implementation first.
- If the loss is worse than the backtest's worst case under the same conditions, or the drawdown is deeper than the max drawdown over the full period, the strategy's assumptions may have stopped holding.
- If the backtests over both the last 180 and 365 days have weakened, the edge is decaying.
- If none of the above apply, keep the strategy.
Implementation comes first because when it has a bug, every check after it is looking at the wrong numbers.
The first automatic trigger caught bugs in the review code
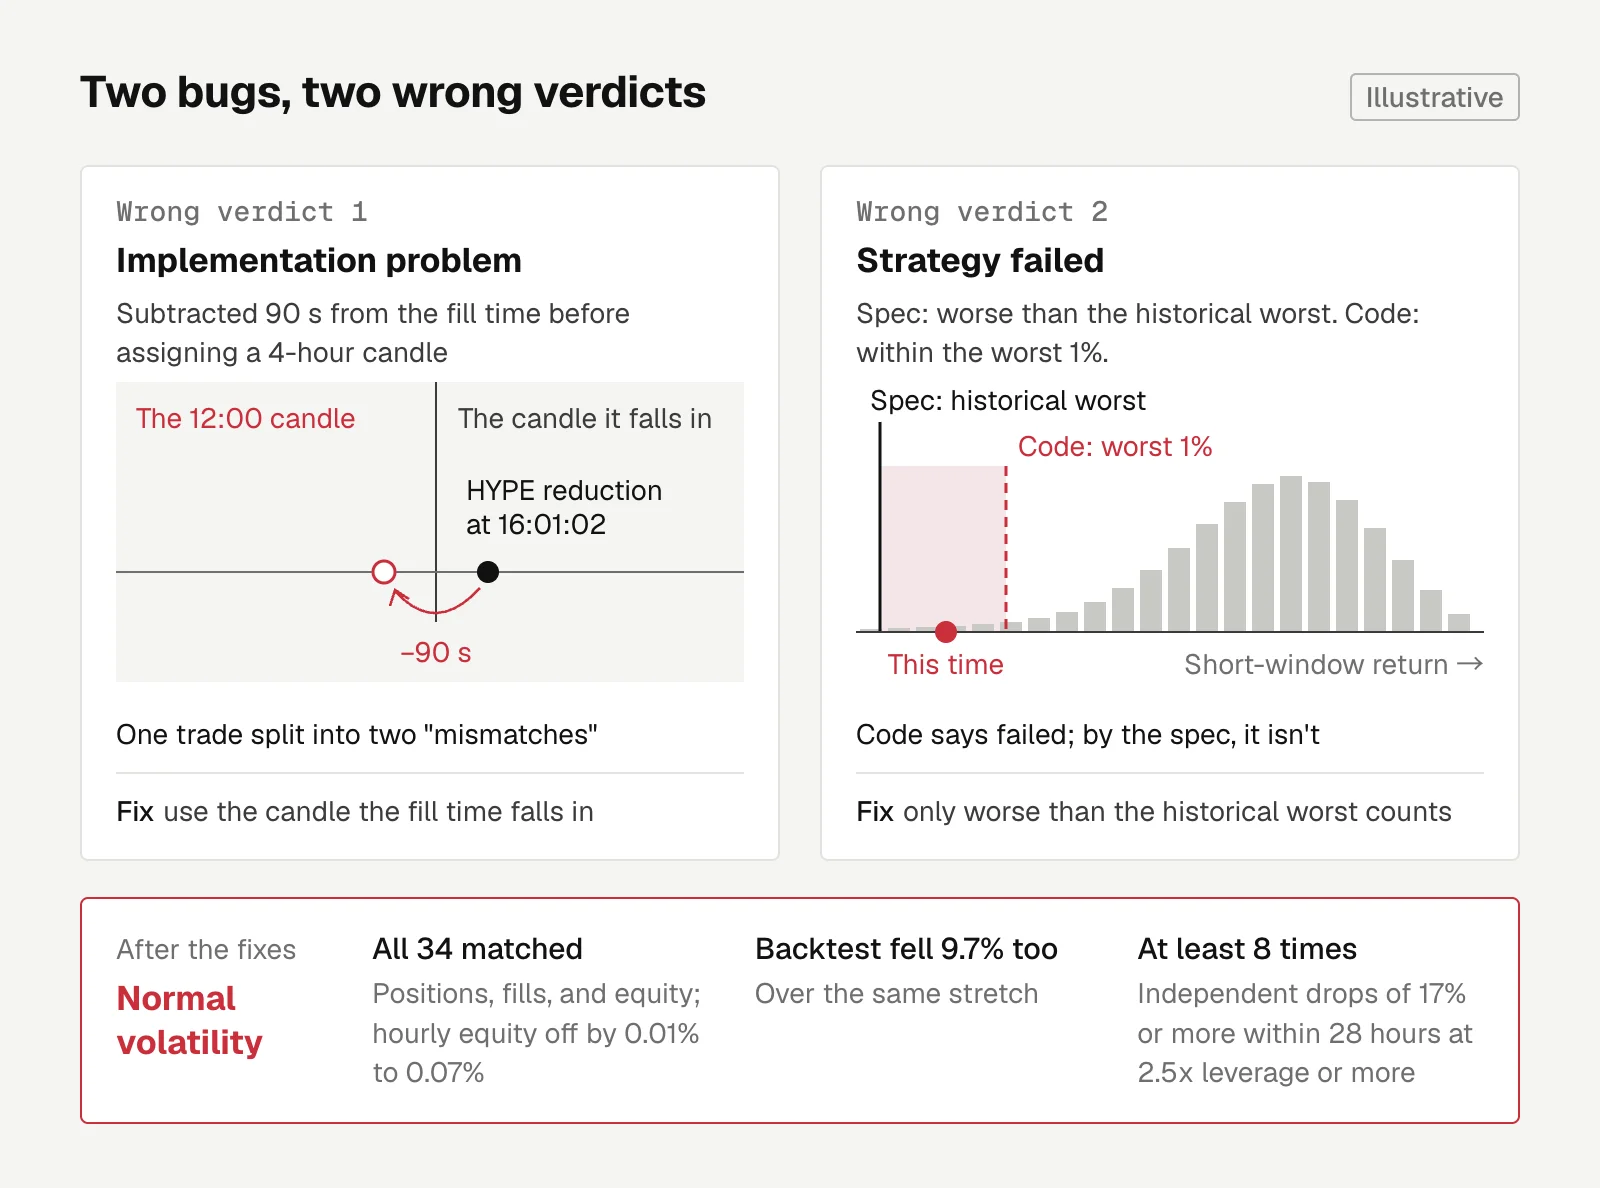
The day after the account opened, drawdown from the peak reached −20.3% and the watcher fired automatically.
The first bug was in fill matching. The code subtracted 90 seconds from the live fill time before assigning it to a 4-hour candle, so a HYPE position reduction at 16:01:02 landed in the 12:00 candle. One trade was split into two "mismatches," and the verdict was that the implementation had a problem. I changed it to use the candle the fill time actually falls in.
The second was in the decision condition. The spec said "worse than the historical worst case," but the code said "within the worst 1%," and the verdict was that the strategy had failed. A 1st-percentile event over a short window is something that simply happens. The two conditions are far apart.
After the fixes, all 34 positions, fills, and equity matched, with hourly equity off by 0.01% to 0.07%. The backtest over the same stretch also fell 9.7%. At 2.5x leverage or more, independent drops of 17% or more within 28 hours have happened at least 8 times historically. The unleveraged basket of positions fell only about 4.6%, and multiplying by roughly 3x gives this loss. The verdict was normal volatility.
13 risk-reduction variants, none passed
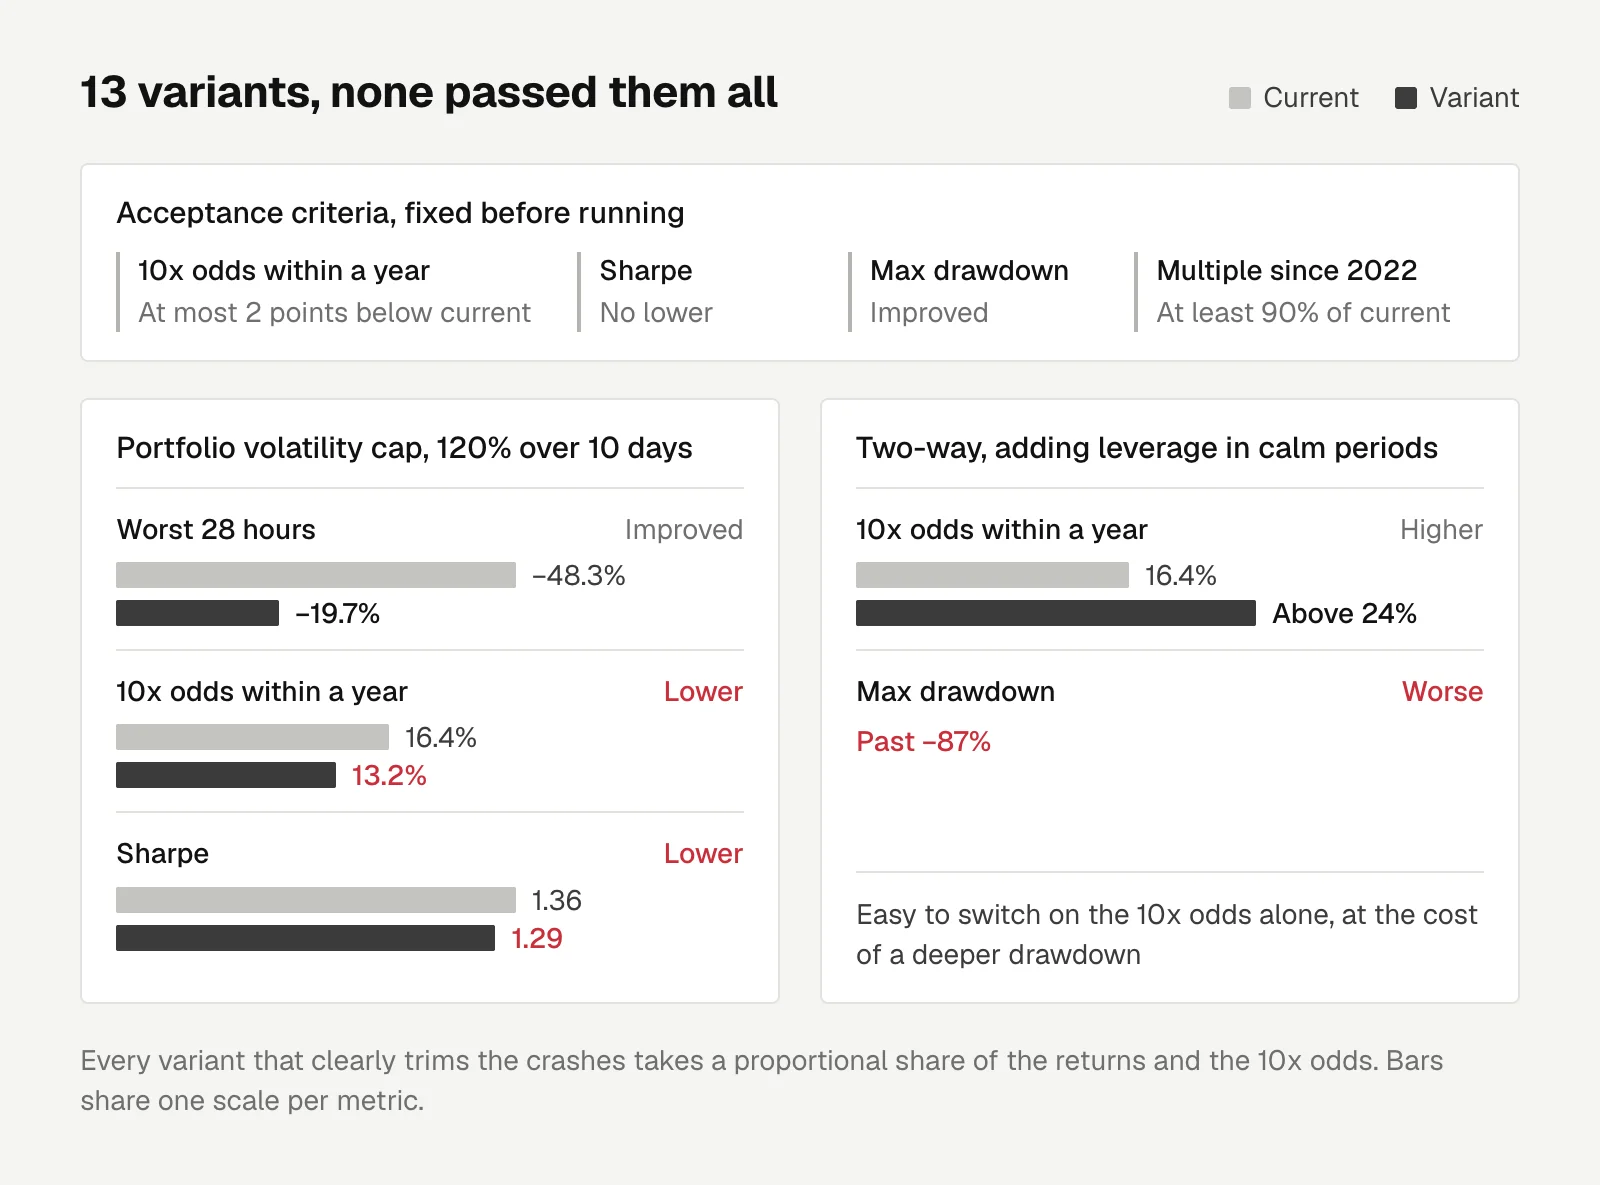
The report also pointed out a structural problem: 34 highly correlated longs amount to one big bet in a crash. The current weighting only controls each coin's volatility, not the portfolio's. In the backtest, at 2x leverage or more, the worst 28 hours came to −48.3%.
I tested 13 variants aimed at this, with acceptance criteria fixed before running them: the probability of 10x within a year no lower than the current one minus 2 percentage points, Sharpe no lower, max drawdown improved, and the multiple since 2022 at least 90% of the current one.
None passed all of them. A portfolio volatility cap of 120% over a 10-day window cut the worst 28 hours from −48.3% to −19.7%, but the 10x probability fell from 16.4% to 13.2% and Sharpe from 1.36 to 1.29. A two-way adjustment that also adds leverage in calm periods pushed the 10x probability above 24%, but max drawdown worsened past −87%.
So I changed nothing. The portfolio volatility cap is already tested and can be swapped in directly if I ever care more about safety. The mechanism ended along with the project two days after going live, having run two reviews in total.
What I learned
- The review tool is itself code that needs testing. Its first real trigger caught two bugs, one claiming an implementation problem and one claiming strategy failure, and a wrong conclusion nearly drove the decision.
- The spec and the code have to agree. "Worst 1%" and "worse than the historical worst" look alike and mean very different things.
- I haven't found a free way to cut tail risk. Every variant that clearly trims the crashes takes a proportional share of the returns and the 10x odds with it.
- Set acceptance criteria first. Looking only at the 24% chance of 10x, it would have been easy to switch, at the cost of a −87% drawdown.

Engineering
A Full-Site Redesign: AI Scores Make a Bad Gate, So Swap Tokens First and Rework Layouts Later
EZLO swapped dark rounded cards for a square-cornered, paper-and-ink blueprint style. AI review scores work only as a regression list; swapping token values first reskinned 90% of screens in one PR.
Letters
Loading comments…